Mobile app metricsare a measure of an app’s performance. Ultimately, if your goal is for your app to have the highest user engagementand conversion rate, it’s a must to pay attention to them. Any mobile app marketing agencywill say as much. The difference lies mostly in what techniques they employ to help app owners achieve success.
Of course, much like any kind of analytics endeavor, this entails diving into the numbers and details. Here’s a full view of every vital Mobile app marketing KPI for any app’s success.
Performance-based Metrics
Crashes
They occur due to bugs, error handling, outdated OS, etc., forcing the user to start all over again.
The key to getting on top of this Key performance metric is by knowing the exact times they occur, the users they affect, what triggered them, and how frequently they happen.
Loading Time
Arguably, one of the most important Mobile App performance metrics, because in-app loading times, slow means low (users and success rate). With many people being used to how fast things are in the digital world, your app needs to be able to keep up with that expectation.
As much as possible, it should load no more than 2 seconds.
Our app marketing team advises using a CDN and keeping the code as light as possible to help speed up loading times.
Latency
Refers to the time in which the app is able to make a request and acquire a response from the API. Much like loading times, the lower the latency, the better
It’s important for the gold standard when it comes to optimizing latency. In apps, it should only take a second for the said process.
Engagement-based Metrics
DAU/MAU
Short for daily active users and monthly active users, respectively, these numbers serve as a more accurate gauge of how many people actually use your app. It also reveals the days and weeks when users are most and least active.
Formula/Tip: Check the number of users that perform any action in-app.
Retention Rate
A basic factor in mobile app user acquisition is the rate at which users return to your app within a specific duration.
We prefer to measure retention rates as in-depth as possible. In most cases, this is referred to as cohort analysis, and from there, advise the owner about what updates to do to overcome low rates.
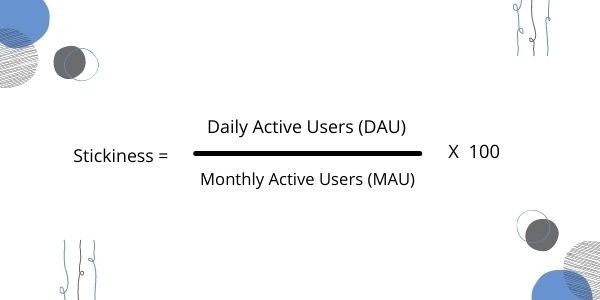
This answers the question, how many user sessions happen in your app in a month, with the number of days in that timeframe factored in? Of course, a higher ratio (in percentage) only connotes daily frequency of usage and better profitability.
Even a 20% stickiness ratio is already considered decent, so aim for anything over that.
Session Length
This means the average amount of time the user spends in-app. Like DAU/MAU, how you interpret it is highly dependent on your app’s niche.
A streaming app will definitely consider a longer average session length as a sign of better engagement. On the other hand, if it’s the case in on-demand apps like Uber, that may mean delays, which almost any commuter doesn’t want.
Formula: Total time taken by all sessions in a specific timeframe / Total sessions during that timeframe
Churn Rate
Refers to the rate at which your users cancel subscriptions in-app or uninstall them. Arguably, all users you lose are a setback for your app, but if they include high-value users that bring in the highest revenue and ROI potential, it can signal disaster.
Aim to keep your three-month churn rate below 70%.
Formula: 1 – the app’s current retention rate
Exit Rate
Gives you an inkling about the least-converting screens your app is presented in. It’s pretty similar in concept to bounce rate, but with a focus on which screen causes the number of users to nosedive (i.e. drop-off).
We employ marketing automation software to make it easy for us to determine the exact number of drop-offs from each screen.
Formula: Total visits to a screen / Total number of exits from it
Are You Ready to Boost your Mobile App Performance?
Our expert mobile app marketing team provides you with the ultimate data-oriented research that helps to analyze the strategies needed to improve mobile app performance. Get expert support with in-depth mobile app analytics.
Shows how many users are deriving value from your content. These goals are myriad and can be based on actions you want users to take like registering, purchasing, submitting forms, etc. It’s a key metric simply because these goals often share profitability as a common denominator.
Time to Goal Completion
Tells you how long it takes for users to perform an action (i.e. achieve your goal). This is always relative to the steps that people undergo in the user journey. With this metric, you’ll be able to know the ones that are hindering the user or causing drop-offs.
Our marketing experts rely mostly on CRO tools and marketing automation to determine this.
Average Order Value (AOV)
AOV is mostly concerned with pricing since it gives you insights regarding the average money spent by users on any order they place in-app. In so doing, you’ll be able to adjust your marketing and pricing strategies accordingly. That said, you should aim to increase it as much as possible.
Acquisition-based Metrics
Cost Per Install (CPI) / Cost of Acquiring a Customer (CAC)
A must-know metric in all App install campaigns, this reflects the average money you shell out with every download or user acquired in general.
You need to keep it as low as possible because the moment it surpasses the Customer Lifetime Value, that essentially means you’re in the red with every download.
Formula: Total marketing cost / Total acquired users
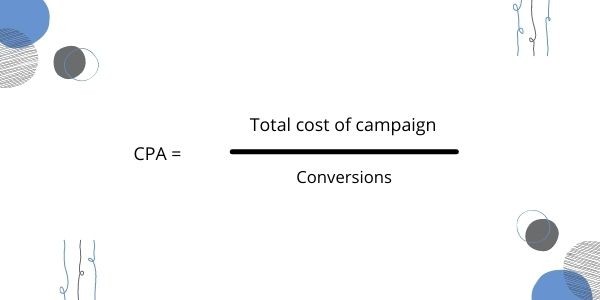
CPA
Indicates the cost per acquisition/action, meaning the total money you spend relative to the conversions (or revenue) you acquire. That said, it’s a vital gauge of the app’s financial success.
We employ a variety of methods to track this like implementing the MMP tools.
Customer Lifetime Value (CLTV)
Overall, this reflects the user’s total perceived profitability, from the moment they start using the app to when they uninstall it. It’s a good gauge of how much you’re spending to acquire users, too.
To boost it, you need to identify the correct acquisition channel to target, create the proper user segments, and conduct the appropriate marketing strategies for them.
Formula: Average conversion value x Average customer lifetime x average conversions over a timeframe
Average Revenue Per User (ARPU) & Average Revenue Per Paying User (ARPPU)
This may seem a lot like CLTV, but one obvious distinction stems from the fact that ARPU is concerned with the present profitability of the user while the former is more about the future.
Formula: Lifetime revenue / Number of paying users
Vanity Metrics
Average Screens Per Visit
Tells the number of screens the user visits, which is a good sign of user engagement. Still, it doesn’t really tell you which screen is resulting in better (or worse) engagement.
No. of Registered Users
Reveals the total number of users registered to your app. While knowing that you have 1,000,000 registered users may seem great, it’s not really helpful if your MAUs are hovering below 60.
App Downloads
App owners launch campaigns solely to increase app downloads. Sure, that’s a viable move, but it should only ever be considered as a starting point for user engagement and retention. That’s precisely why it’s not worth counting this metric.
Average Daily Sessions per DAU
Reveals the number of sessions per user that occur daily. As we’ve said before, this is only helpful to apps in certain niches, namely social media-centric ones.
Conclusion
Unless you’re developing apps solely for the fun of it, you can never really skip Mobile app analytics. Otherwise, it’s like navigating the ocean without a map or compass. Technically, these metrics give the best clues to how you can improve your app.
We know that you are an app owner who wants nothing less than optimal success for your brainchild. That’s why we’re here.
If your website still relies on old-school SEO tactics, your digital strategy already falls behind in Google’s Next Search Algorithm Shift. User behavior now evolves faster than ever, changing how people search, discover, and interact with content.
AI-powered search engines...
If your website still functions like a digital brochure, you’re already losing opportunities-every single day.
In today’s fast-moving digital space, attention spans are shrinking while expectations are rising. Users don’t just browse anymore-they expect instant answers, personalized journeys, and seamless...
Most businesses today are scaling operations, expanding digital channels, and generating massive amounts of data. Yet their applications remain slow, reactive, and dependent on manual inputs.
This gap is exactly why AI-Native Apps are becoming essential. Instead of reacting to...
If your business still relies on static apps that follow fixed rules, you’re already losing users to competitors offering smarter, more intuitive experiences. Today’s customers expect apps that understand their behavior, predict their needs, and continuously improve. This is...
In today’s competitive digital landscape, many businesses struggle to generate consistent, high-quality leads. Studies show that nearly 61% of B2B marketers consider lead generation their biggest challenge. Whether you're a startup or an established brand, B2B lead generation services...
If you’ve been investing in content but struggling to scale organic traffic, you’re not alone. Many marketers hit a ceiling-publishing blogs manually takes time, resources, and consistent effort. This is where Programmatic SEO changes the game. Instead of creating...
If your website ranks on Google but still doesn’t appear in AI-generated answers, you’re already losing valuable visibility. In fact, users are increasingly relying on AI-generated responses for quick, direct information. Therefore, with the rise of Bing AI Search,...
Digital marketers and eCommerce businesses are hitting a ceiling with traditional automation. While automation has streamlined operations and reduced manual effort, it no longer delivers the level of intelligence required to compete in today’s fast-paced digital ecosystem.
This is where...
Running Meta Ads for SaaS products can feel like a double-edged sword. While SaaS Companies Reduce Meta Ads Cost Per Lead by leveraging smarter strategies, platforms like Facebook and Instagram still present challenges with rising CPL and fluctuating ROI.
If...
In today’s rapidly evolving digital ecosystem, ranking on Google is no longer the only indicator of online success. Many businesses are now experiencing a visibility gap-while their websites perform well in traditional search engines, they are not being featured...


![The Game Marketing Guide: Pre and Post-Launch Strategies [Infographic]](https://www.dotcominfoway.com/wp-content/uploads/2023/09/DCI-Game-Marketing-blog-1.jpg)